2025 Survey: DES Data Insights

2025 School Digital Marketing Survey (Part-3: DES Data Insights)

DES data analysis explores approximately 1,000 (969) Instagram posts published by schools between January and March 2025.

Part-3: Release V1 – Monday 1st September 2025

This digital survey ouput is structured in to three parts (Part-3 – DES data analysis is outlined below):

Part-1: 2025 Survey Results Summary – a snapshot of current behaviours and challenges from the 2025 school survey – View Part-1&2 here.
Part-2: 2025 Vs 2023 Data
what’s changed, and what notable insights we can share – View Part-1&2 here.
Part-3: Live DES Data – what can we observe from live social media (Instagram) data?  See below…

With special thanks to the participating schools in the 2023 and 2025 survey research (listed at the end) with special thanks to BISU in Ukraine*.

📊 PART-3 – Section 1

Introduction: DES Data Insights & Summary

What can the analysis of school Instagram posts tell us? 

This anonymised DES data analysis explores approximately 1,000 (969) Instagram posts published by schools between January–March 2025.
By reviewing post types, engagement rates, and content themes, we can benchmark what works best and where schools can gain higher levels of traction. AI has been deployed to analyse the data and to work to our insights & output criteria. 

A note on Instagram Stories
Instagram Stories remain widely used for quick updates, event reminders, and reposts. Because they are temporary (disappearing after 24 hours) and less measurable across multiple schools, Stories are excluded from this dataset. They should be seen as a complementary tool that adds immediacy and personality to feed content.

Digital Survey Part-3 DES data analysed

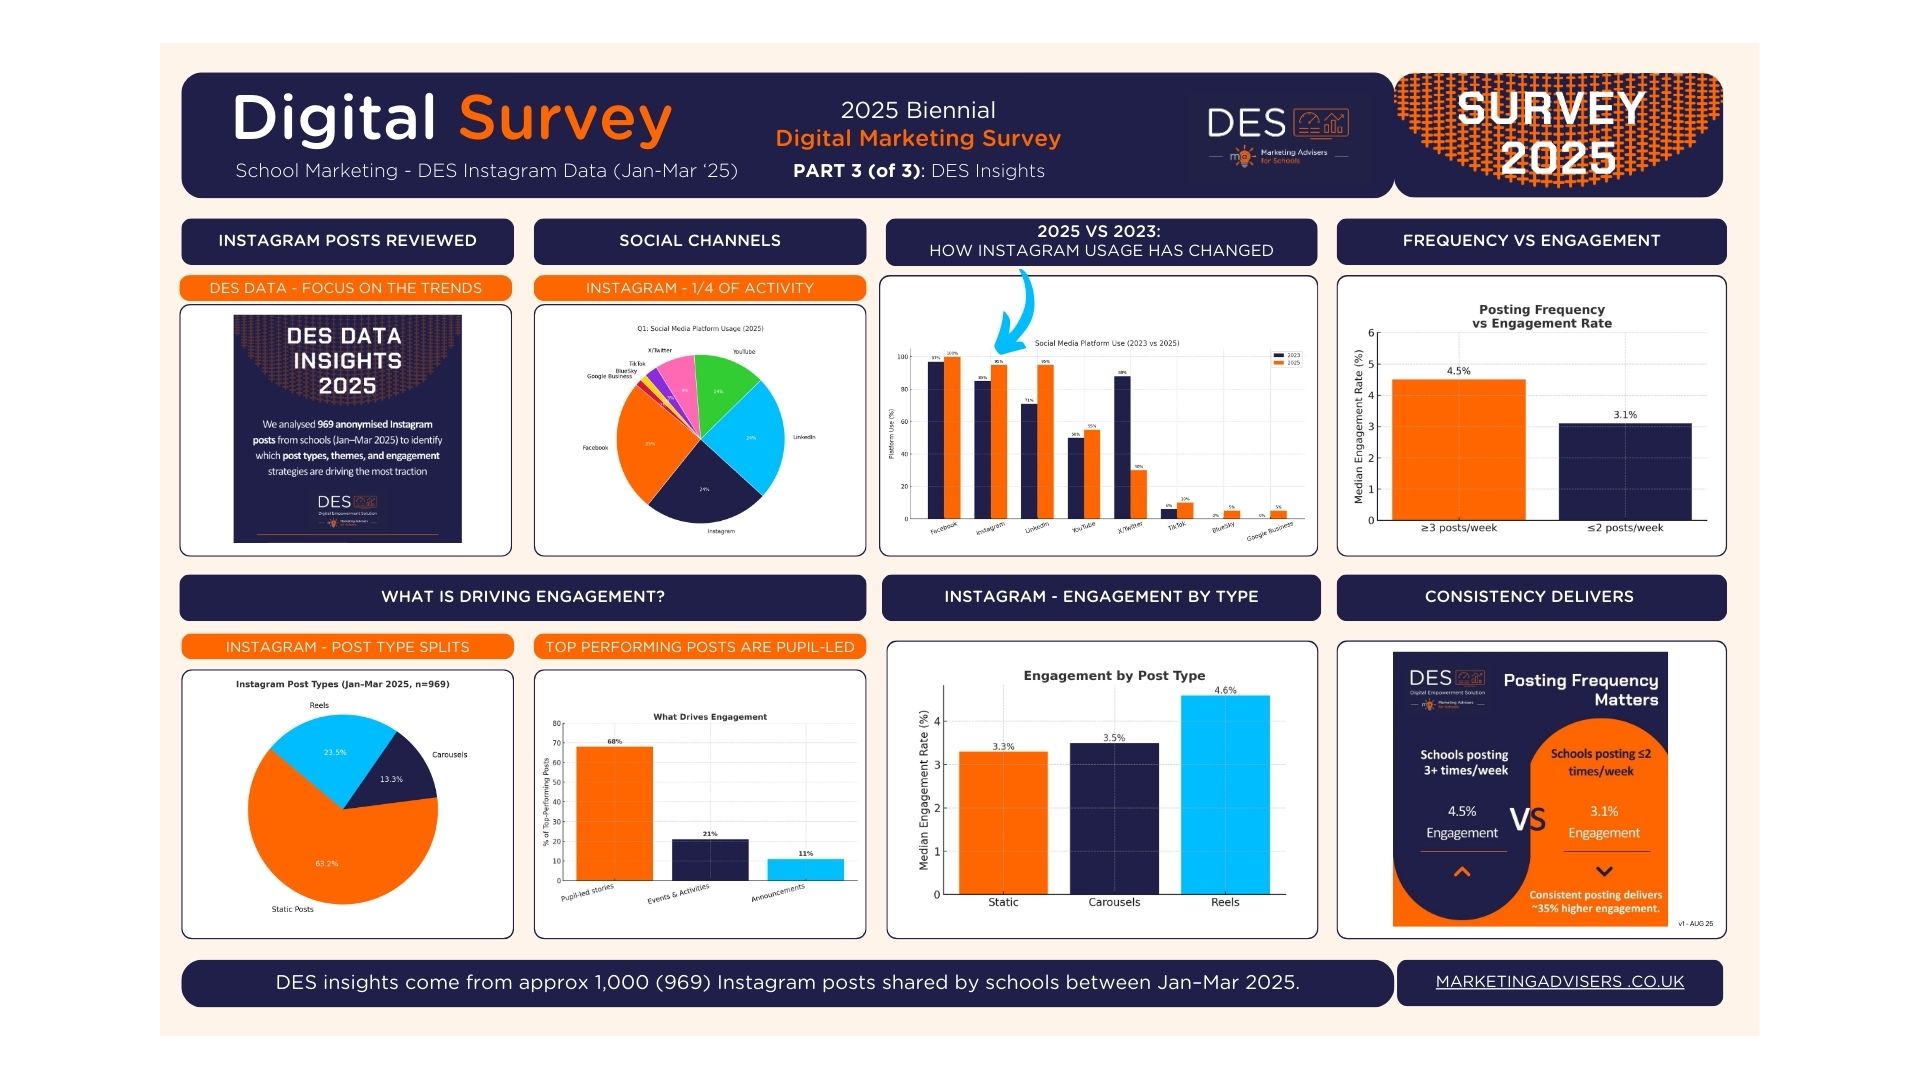
Infographic summarising Part-3 of the Digital Survey: DES Data Insights.

Infographic digital marketing survey 2025 part 3 - DES data
Click above to download the PDF version
Digital Survey Part-3 DES data analysed - Instagram

How can engagement be calculated?

To help us all make sense of engagement across social/digital media channels, and also to allow a comparison across schools of different sizes, we can use a calculation: 

The platform calculates Engagement as:
(Likes + Comments) ÷ Followers × 100 = Engagement Percentage

This provides a median % rate, allowing all schools to be compared regardless of their higher or lower follower count.

Section 2 – Key stats from the Insights

What’s the top-level output?
969 DES posts analysed (January to March 2025)
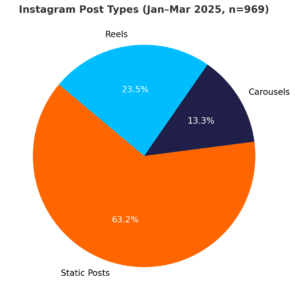
• Over 63% of the Insta post types are static posts
3.8% median engagement rate across all post types
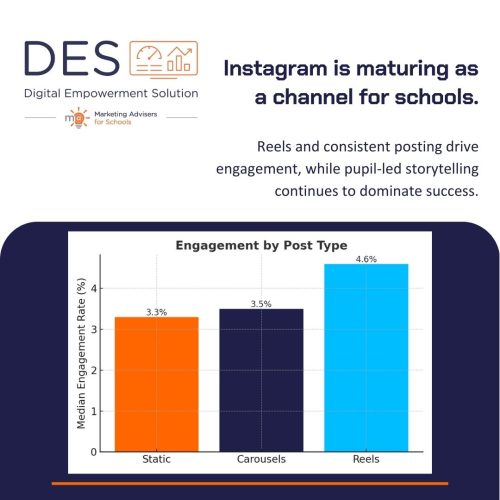
• Reels outperform static posts by ~40% (4.6% vs 3.3%*)
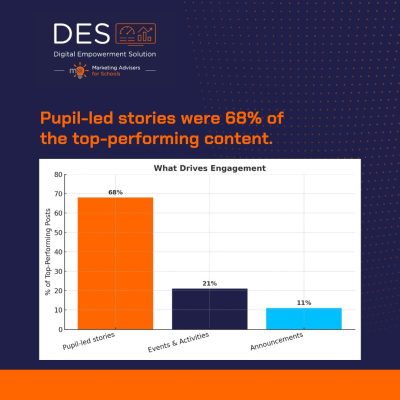
68% of top-performing posts were pupil-led stories
Digital Survey Part-3 DES data analysed - Instagram

Section 3 – Post Type Breakdown

The majority of posts placed are in a static (single image)  format – but which post type tend to receive the higher engagement? Do read on…
• Static posts: 63.2% of the content
• Reels: 23.5%
• Carousels: 13.3%

Median engagement rate by type

Interesting to see Reels surfacing as the Engagement lead.
• Reels: 4.6%
• Carousels: 3.5%
• Static posts: 3.3%
* Reels outperform static posts by approx 40% (4.6% vs 3.3%)
Digital Survey Part-3 DES data analysed

Section 4 – Posting Frequency Matters

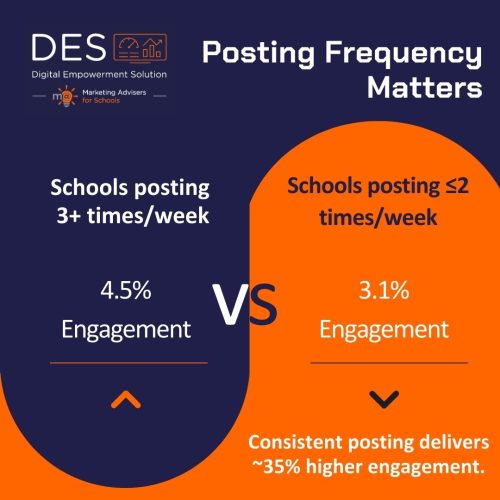
This has been interesting to observe, as there is a respected view around ‘quality over quantity’ but equally finding the sweet spot of the number of posts to consistently place a week is key.
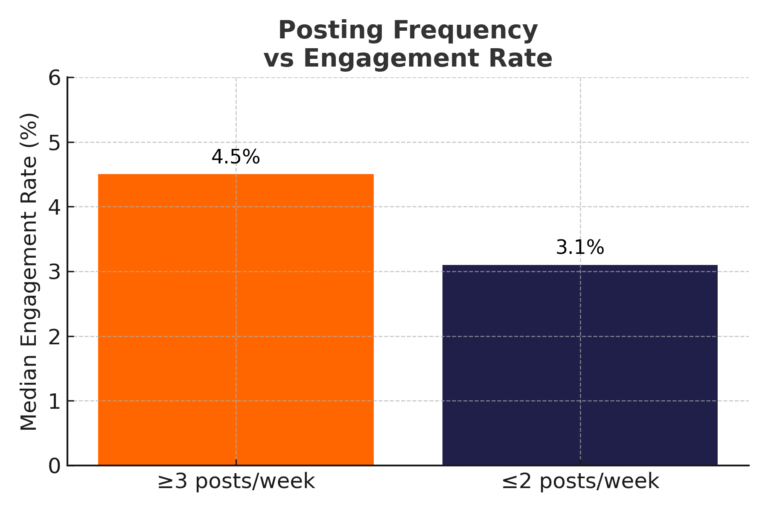
• Schools posting 3+ times/week

→ 4.5% engagement

• Schools posting ≤2 times/week

→ 3.1% engagement

➡️  Schools posting 3+ times per week see engagement lift by approx 35% compared to less frequent social posting.
Digital Survey Part-3 DES data analysed - Instagram

Section 5 – Top-performing content summarised

Among the top posts – pupils and stories of course leading the way.

68% were pupil-led

→ Achievements, stories, quotes

21% were event-focused

→ Concerts, sports, open days

11% were general

→ Announcements
Digital Survey Part-3 DES data analysed

Section 6 – Takeaway

Instagram Reels and consistent posting are helping to drive higher engagement, while pupil-led storytelling continues to dominate success. 

Overall, together with the visual nature, text and posting options to help influence engagement rates – Instagram as a platform is maturing as a channel for schools to continue to optimise and refine.

We look forward to seeing how this channel continues to support schools ans their digital outreach work.

This benchmark sets the stage for our monthly DES live tracker, launching from September 2025.

Source: DES anonymised Instagram data, Jan–Mar 2025 (969 posts). Part of the MA for Schools & DES Biennial Digital Marketing Survey series.

Part-3 of the Digital Survey 2025: DES Data Insights – what’s been working on Insta?

Through the DES Platform we can analyse live anonymised school data to help give insights and learning.
Our future Newsletter will report new updates – Sign-up here.

We would like to extend a huge thank you to those schools who completed the surveys*. We intend to continue to build on this research with future biennial (every 2 years) digital survey updates. 

Support.

If you need help with your digital marketing planning, creating, posting, reviewing and reporting then reach out for a solution for schools.
Review the DES digital marketing solution to help support you and your school. 

Read about us and our unique school focused team – Marketing Advisers for Schools.

By MA for Schools & DES team

* With thanks to the participating schools in the 2025 survey research, and also to the AMCIS organisation for their support to share the survey questions.
Brambletye School, Cargilfield School, Claires Court School, Dulwich Prep & Senior, Edge Grove, Hurstpierpoint College, Ipswich High School, Kelvinside, King’s House, Lancing College, Palmers Green High School, San Anton School, Solihull School, St Edmund’s College and Prep, St James Schools, St Margaret’s School for Girls, The Mall School, The Perse, Tockington Manor School, and Worksop College & Ranby House.
With insights support fromCanford School, Charlotte House Prep School, Eastbourne College & St Andrews Prep, Sedbergh School, St Peter’s York & Windlesham House School.
2022/23 – Research survey respondents.
Dame Allans, Royal High School Bath, Rendcomb College, Canford School, Scarborough College, Shiplake College, Kings House School, Clongowes Wood College, Bristol Grammar School, Highfield and Brookham, Bryanston School, Birkenhead School, St Columba’s College, Prep Schools Trust, Ibstock Place School, Heritage School, Mount School York, Minerva Virtual, Wellington School, Sandroyd School, Marlborough House School, Uppingham School, Salcombe Prep, Hillhouse School (Doncaster), Moulsford School, Lochinver House, Hulme Grammar School.